Reports
Every report, built from the work itself.
Grialink Reports brings together sales, customer service, call and marketing metrics. Review activity from your account and supported integrations, filter reporting periods and compare results. Grial Mind lets authorized team members ask for these reports in private chat.
Included on Pro and Scale plans
-
Calls
Answer rate, quality scored by AI and speed to lead — per closer and per service.
-
Conversations
First response, resolution and wait time across every inbox you run.
-
Pipeline
Conversion by stage and by owner, plus whatever your CRM holds.
-
Campaigns
Ad spend next to the leads, appointments and shows it actually produced.
Seven reports, none of them configured. They fill in from the work your team already does.
- Seven reports, no setup
- AI scoring for recorded calls
- Meta Ads and HighLevel connected
- Exportable agent reports
What you can see
-
Call scoring
AI quality scores for eligible recorded calls when analysis is enabled and credits are available.
-
Speed to lead
How long a new lead waits, overall and per closer.
-
Response times
First response, resolution and wait time across every inbox.
-
Cost per stage
What a click, a lead, an appointment and a show each cost.
-
Pipeline health
Open, won and lost opportunities with the win rate.
-
Stage conversion
Where opportunities move forward and where they stop.
Report 1 · Call Intelligence
Understand the quality of your calls
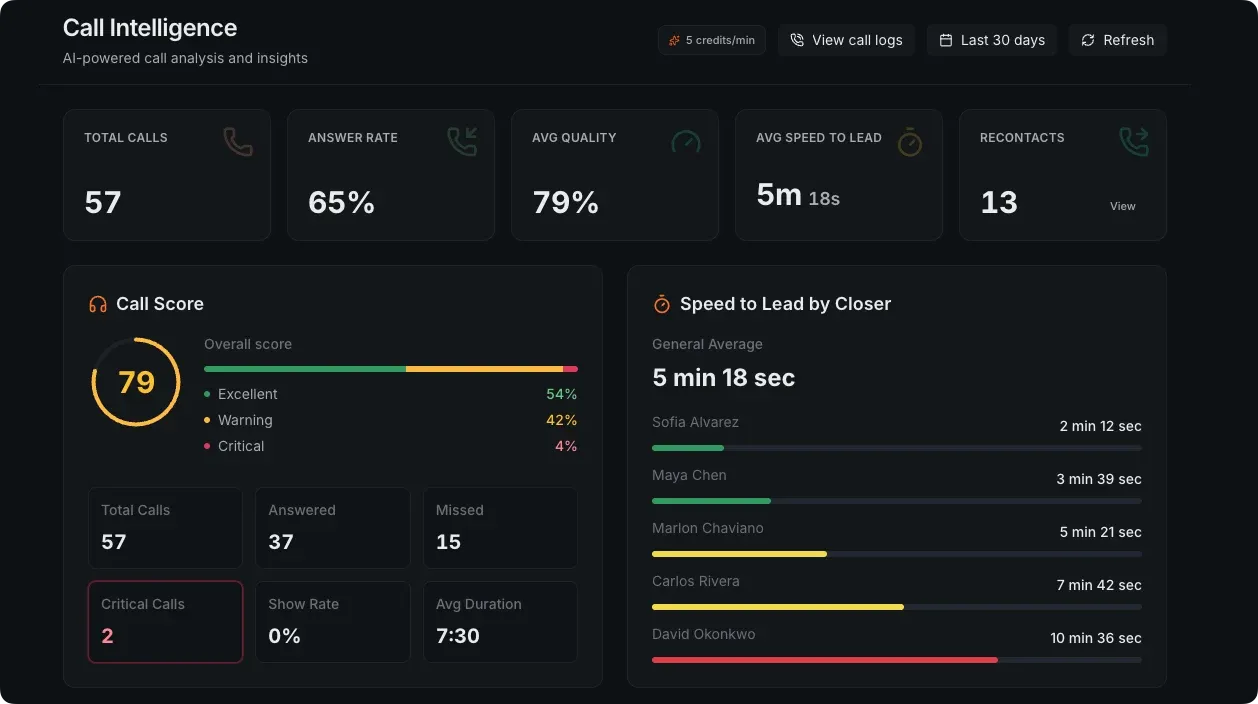
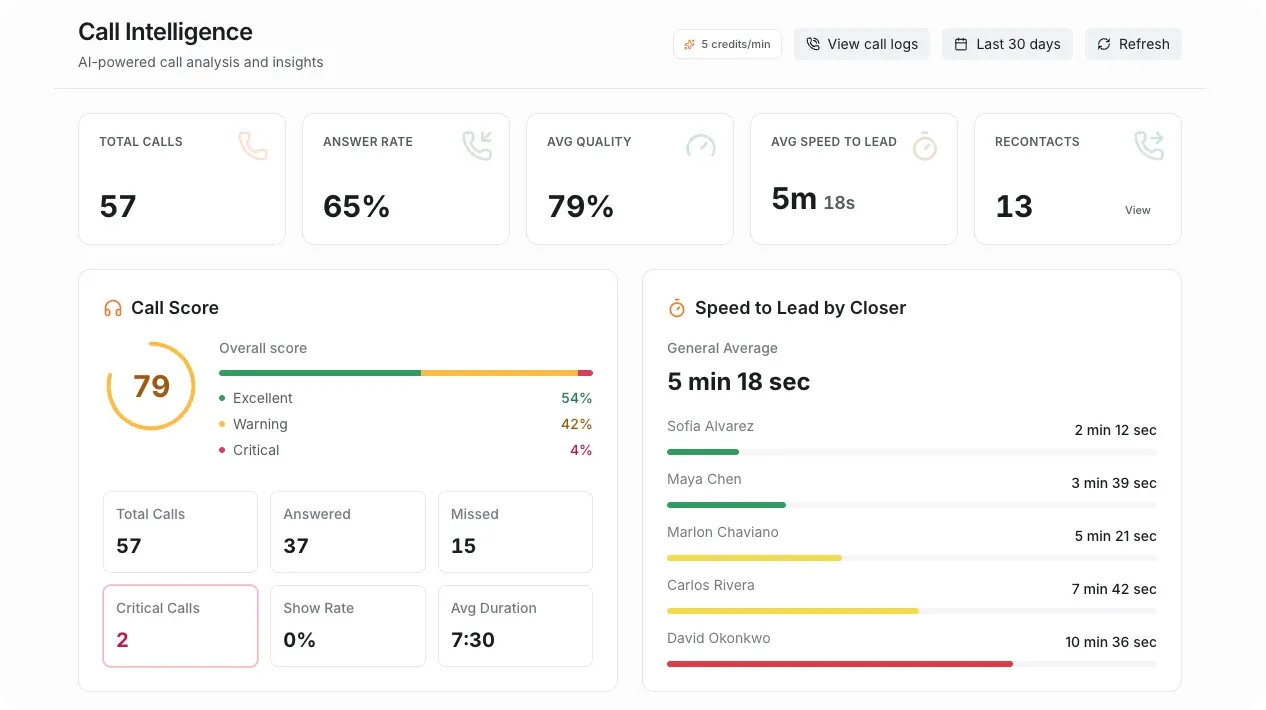
Answer rate, average quality and speed to lead across the period, with an overall call score split into excellent, warning and critical — so a busy phone week and a good phone week stop looking the same.
- Total calls, answer rate and average duration for the period
- A quality score per call, graded excellent, warning or critical
- Speed to lead, overall and broken down by closer
- Critical calls surfaced instead of buried in the log
Report 2 · Closers
The same call report, per person
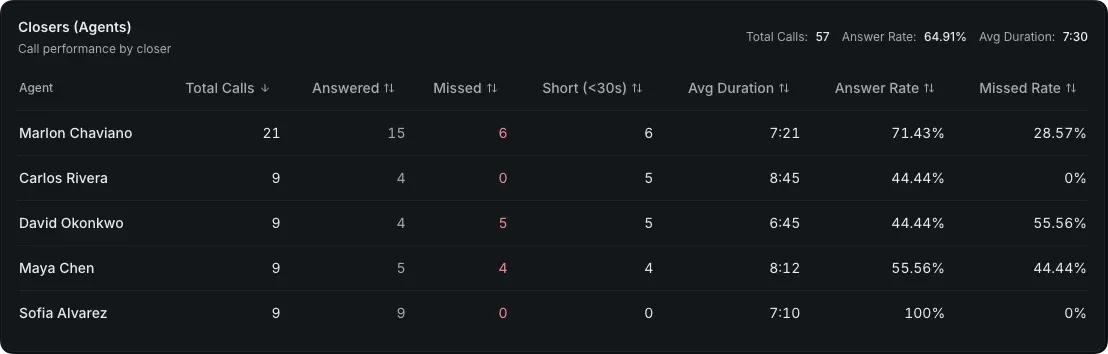
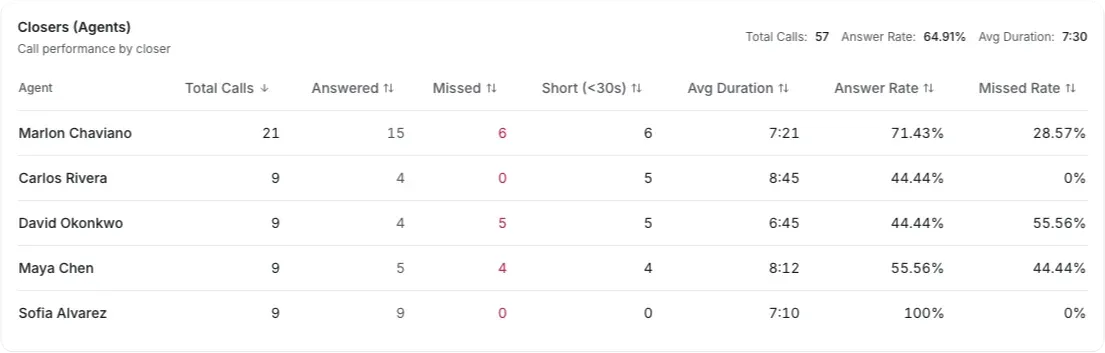
Calls, answered, missed, short calls and average duration for each closer, so coaching starts from what actually happened on the phone rather than from an impression.
- Total, answered and missed calls per closer
- Short calls under thirty seconds counted separately
- Answer rate and missed rate side by side
- Sortable, so the outlier is one click away
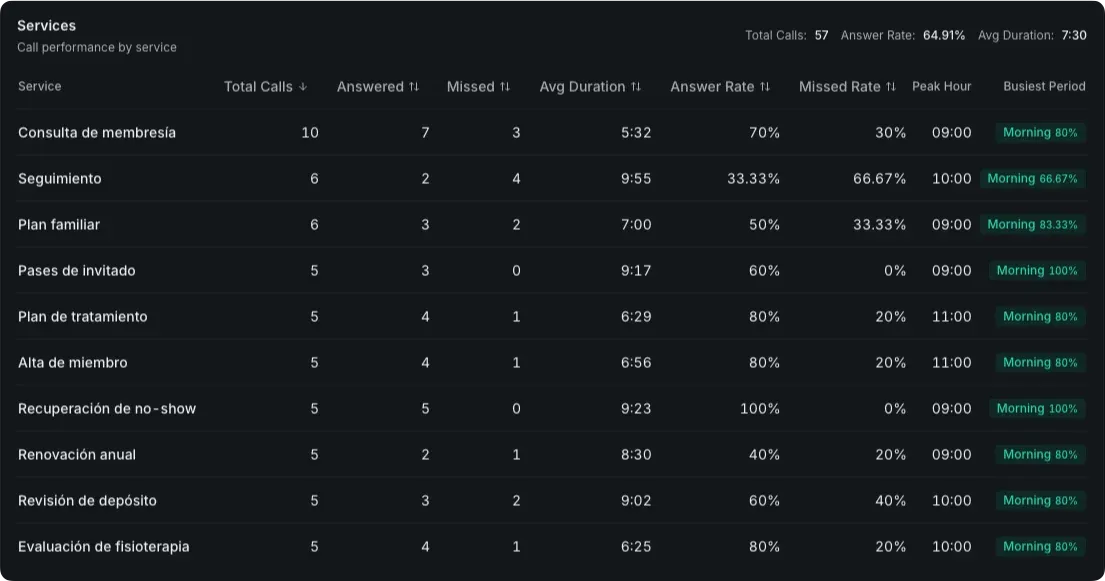
Report 3 · Services
Which service the phone is really ringing about
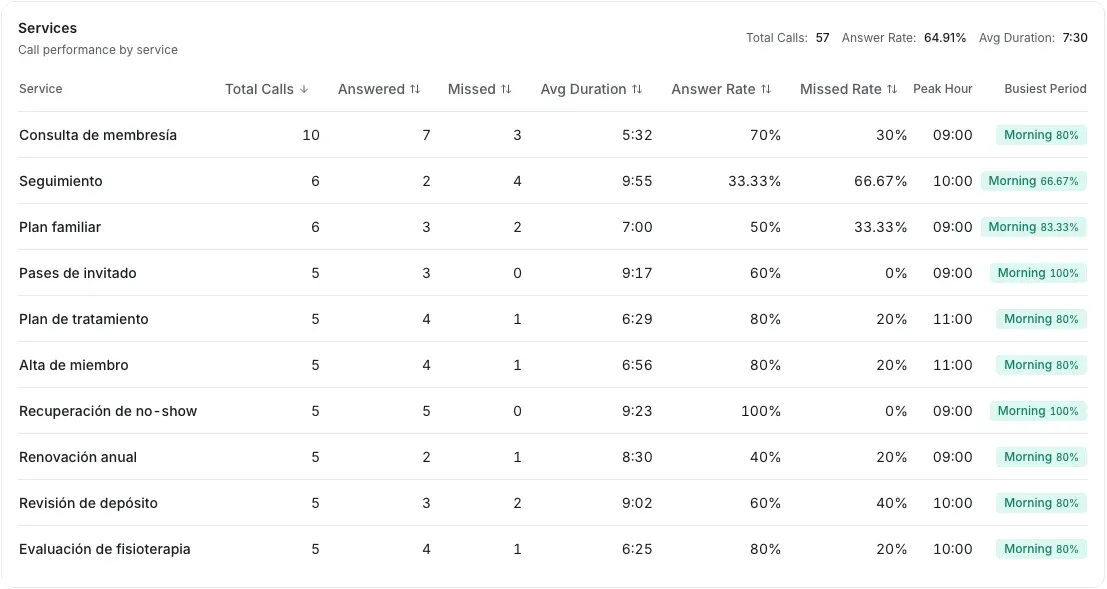
The same call data grouped by what the call was about, with the busiest hour for each one — so staffing follows demand instead of a guess.
- Calls, answer rate and missed rate per service
- Peak hour and busiest period for each one
- Average duration, so long conversations are visible
- The services quietly losing calls, named
Report 4 · Conversations
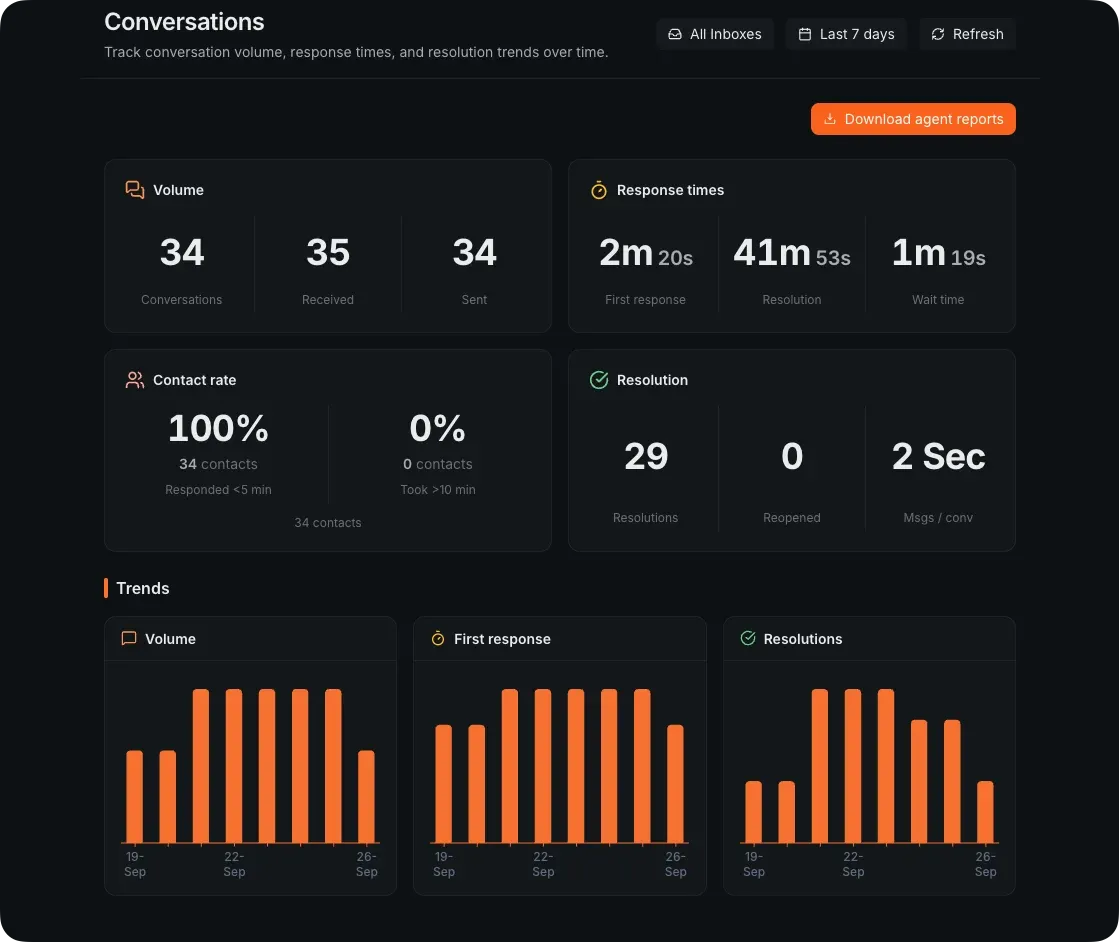
How fast your team actually answers
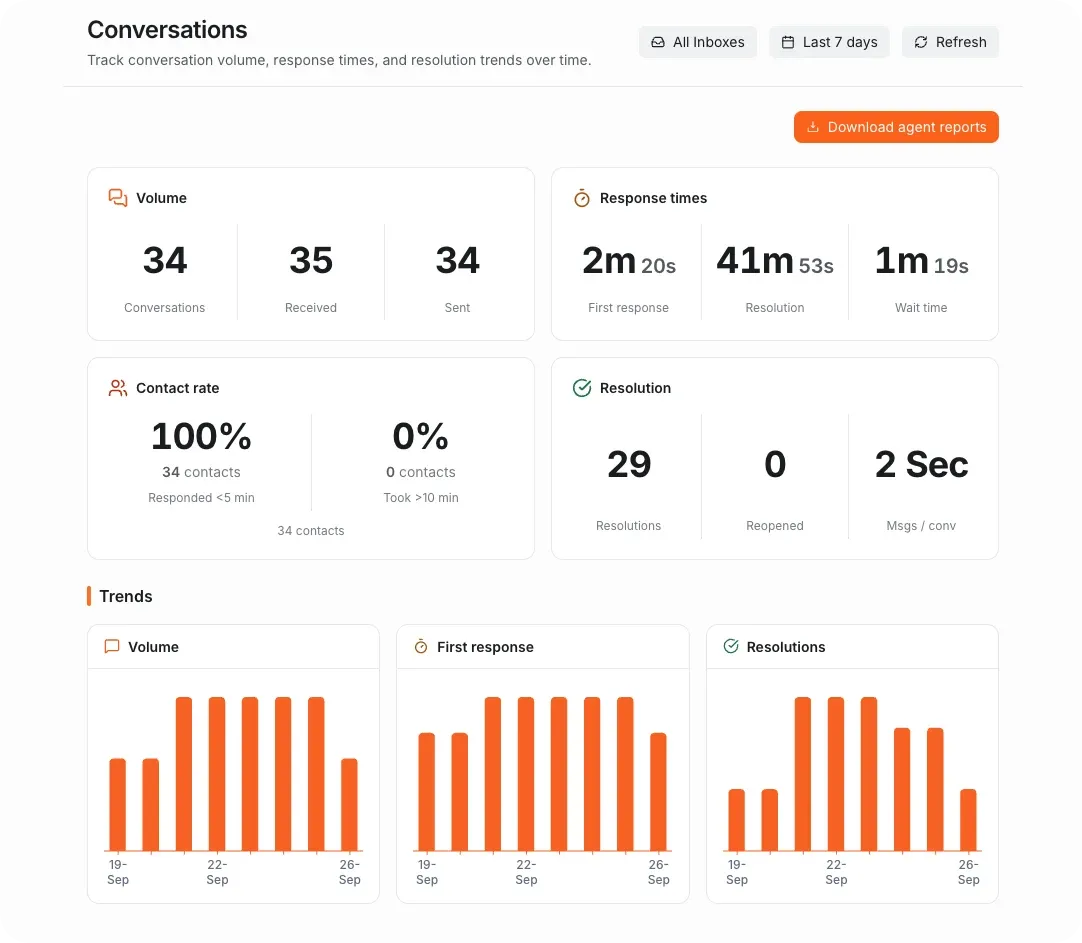
Volume, first response, resolution and wait times across every inbox, with the share of contacts answered inside five minutes and the trend over the period.
- First response, resolution and wait times
- Contact rate: answered under five minutes, or over ten
- Resolutions, reopens and messages per conversation
- Downloadable agent reports for the period
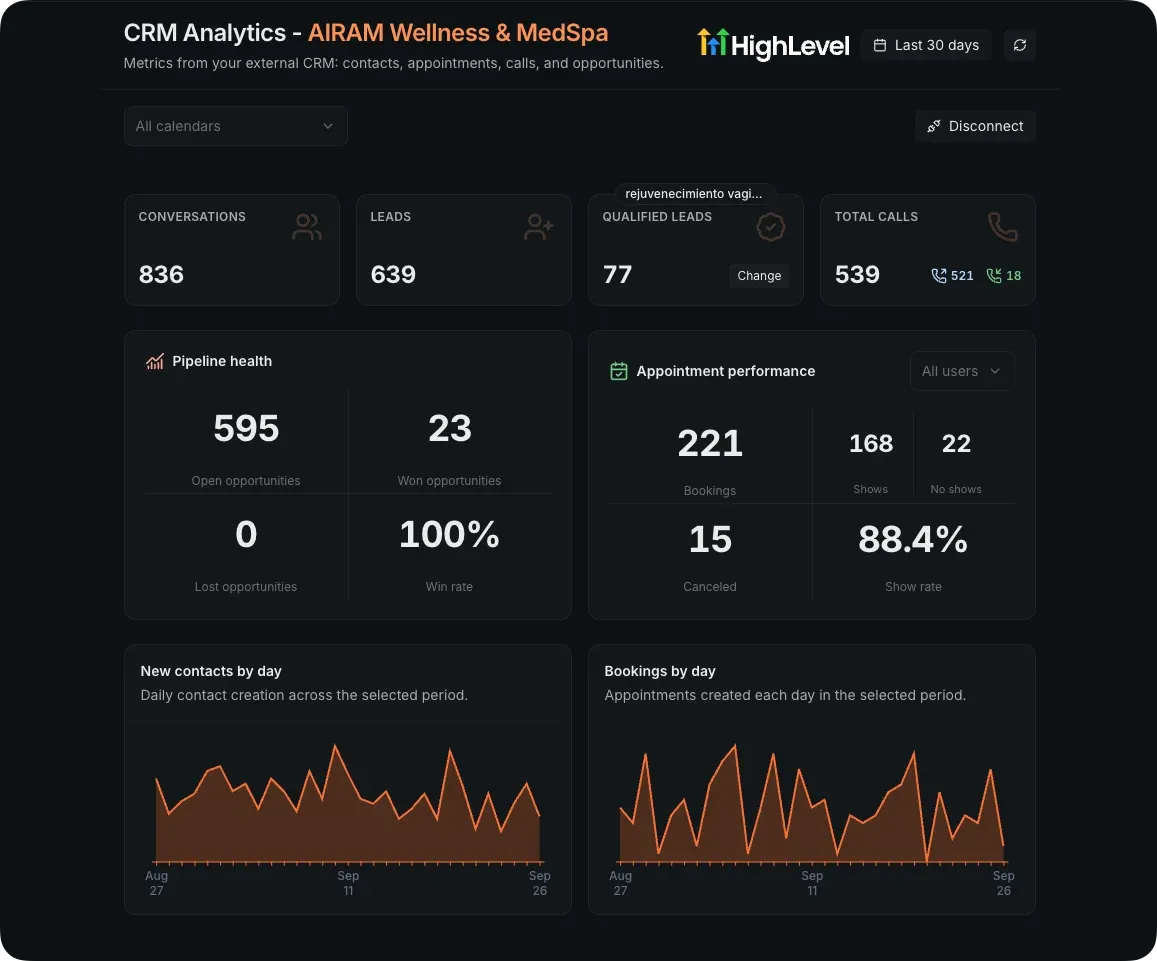
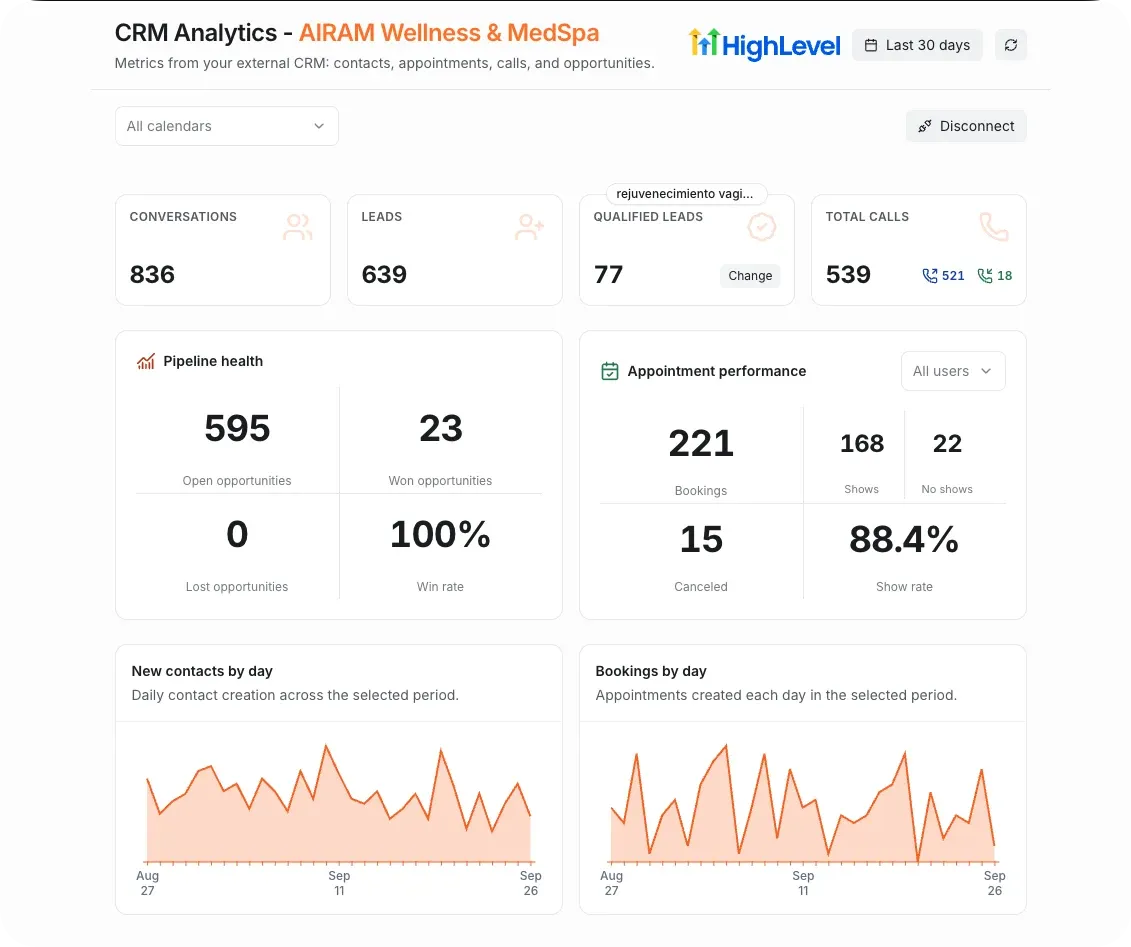
Report 5 · CRM Analytics
Your HighLevel numbers, without leaving Grialink
Connect GoHighLevel and the contacts, appointments, calls and opportunities living there are reported next to everything else, instead of in a second tab nobody opens.
- Conversations, leads, qualified leads and calls from your CRM
- Pipeline health: open, won and lost, with the win rate
- Appointment performance, including shows and no-shows
- New contacts and bookings charted day by day
Report 6 · Marketing Hub
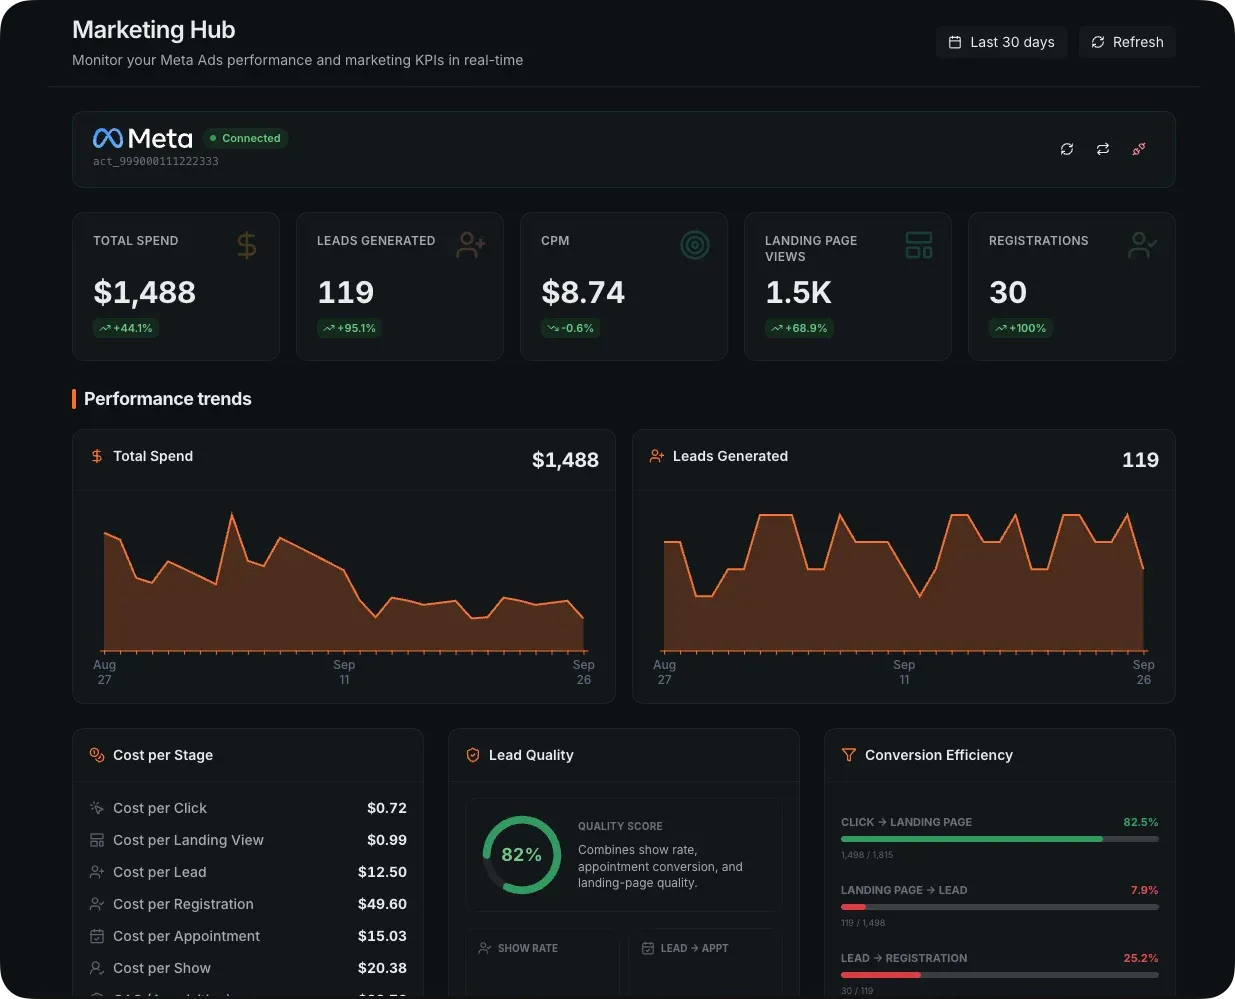
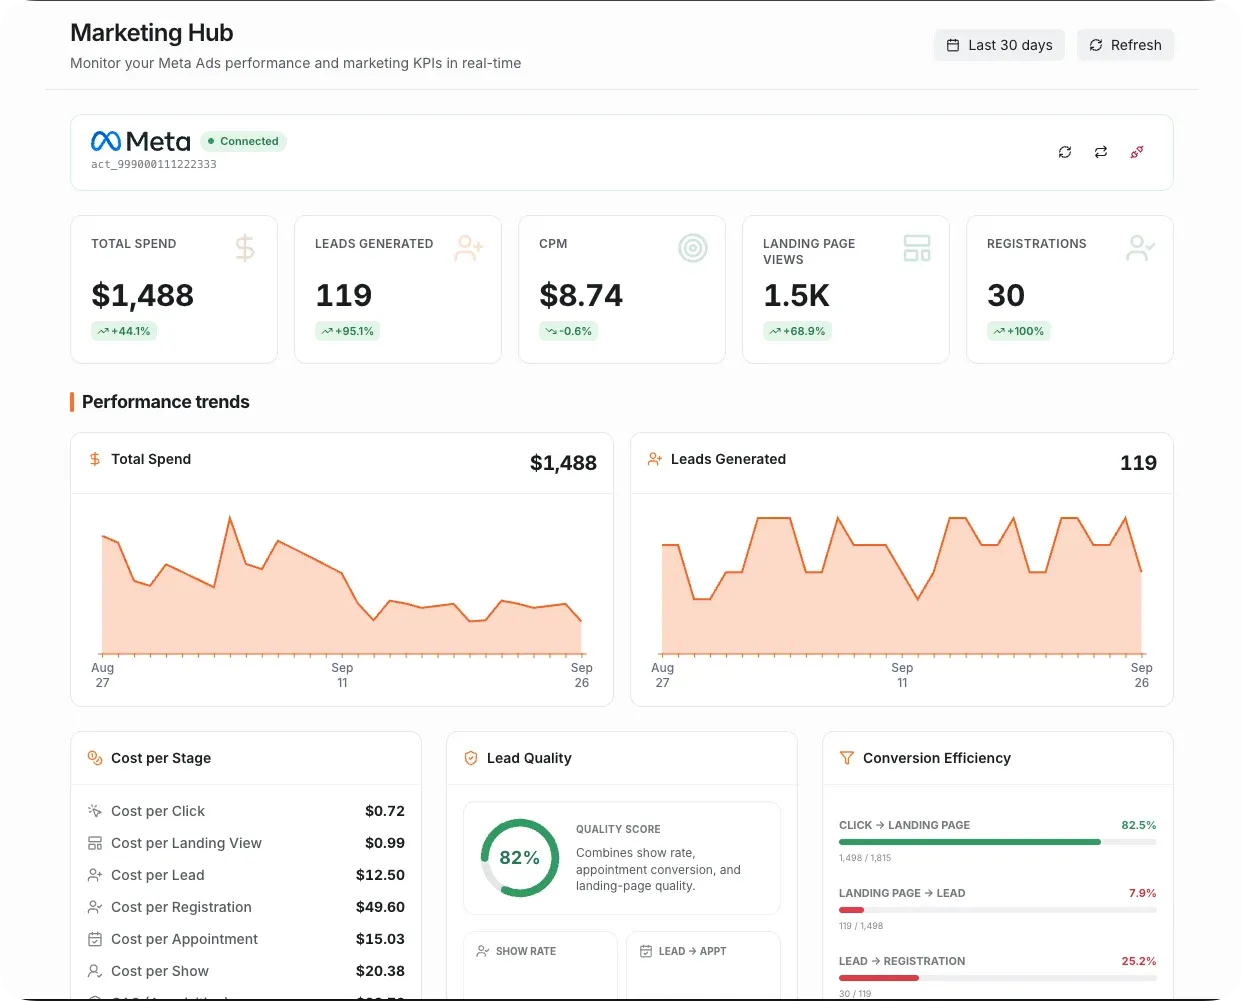
What the ads cost, and what they actually produced
Meta Ads spend beside the leads, registrations and appointments that came out of it, with cost at every stage — so a cheap click that never books stops reading as a win.
- Spend, leads, CPM and landing page views for the period
- Cost per click, lead, registration, appointment and show
- A lead quality score built from show rate and conversion
- Conversion efficiency from click through to registration
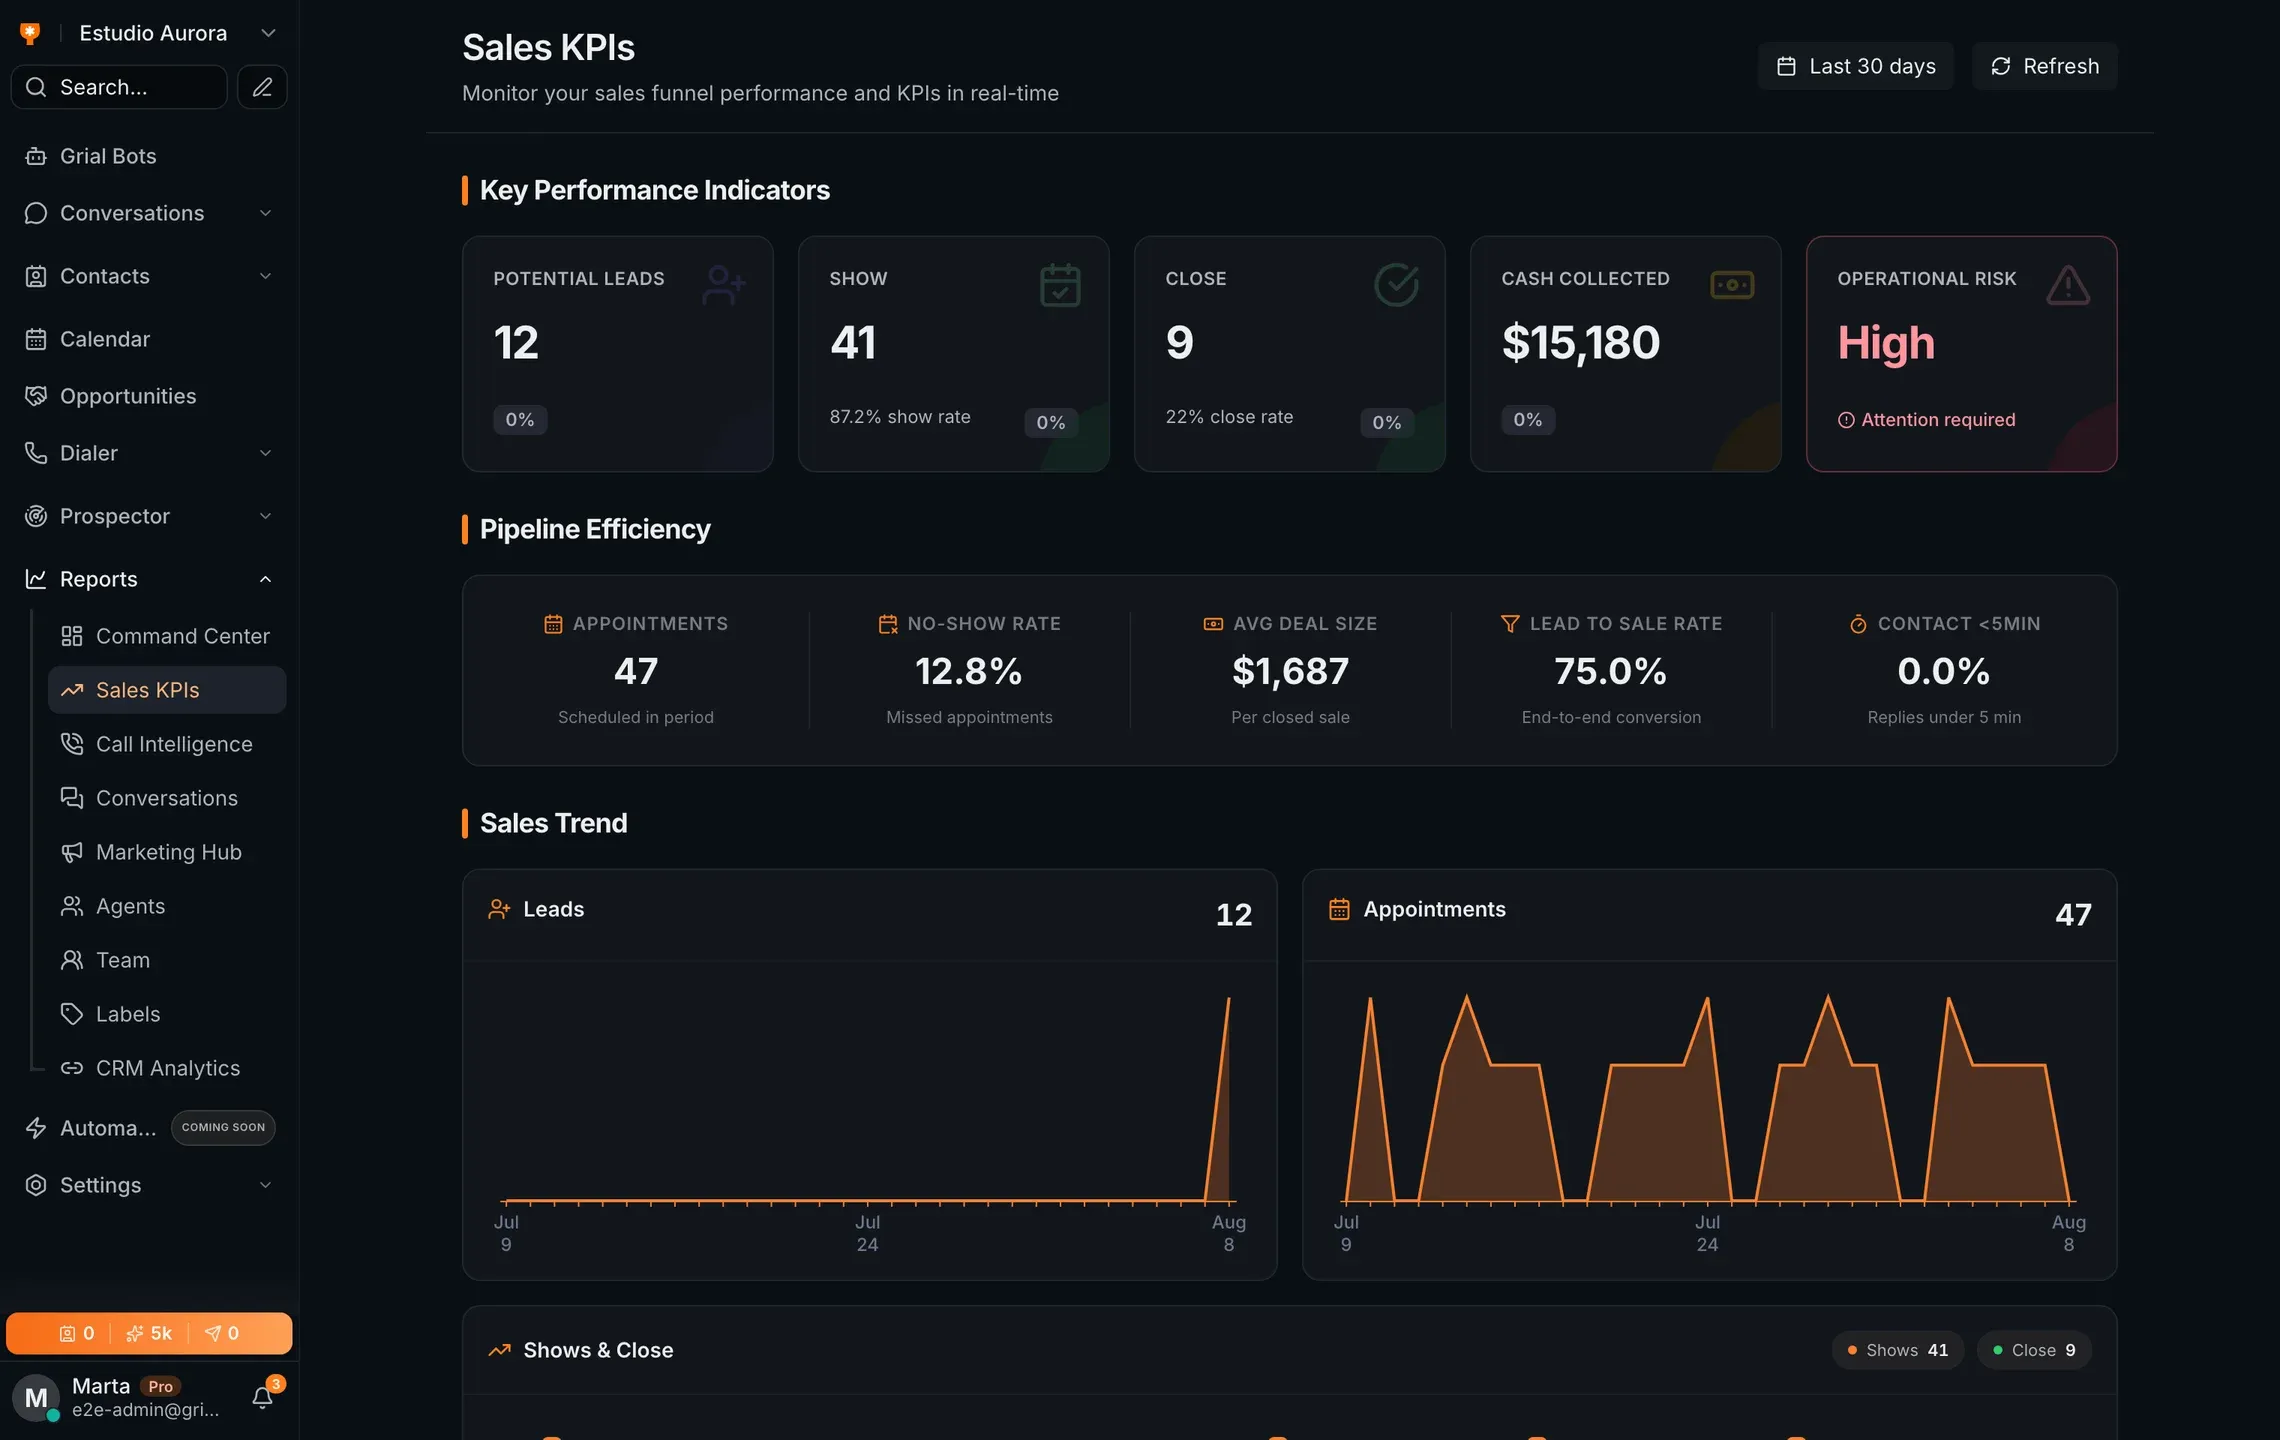
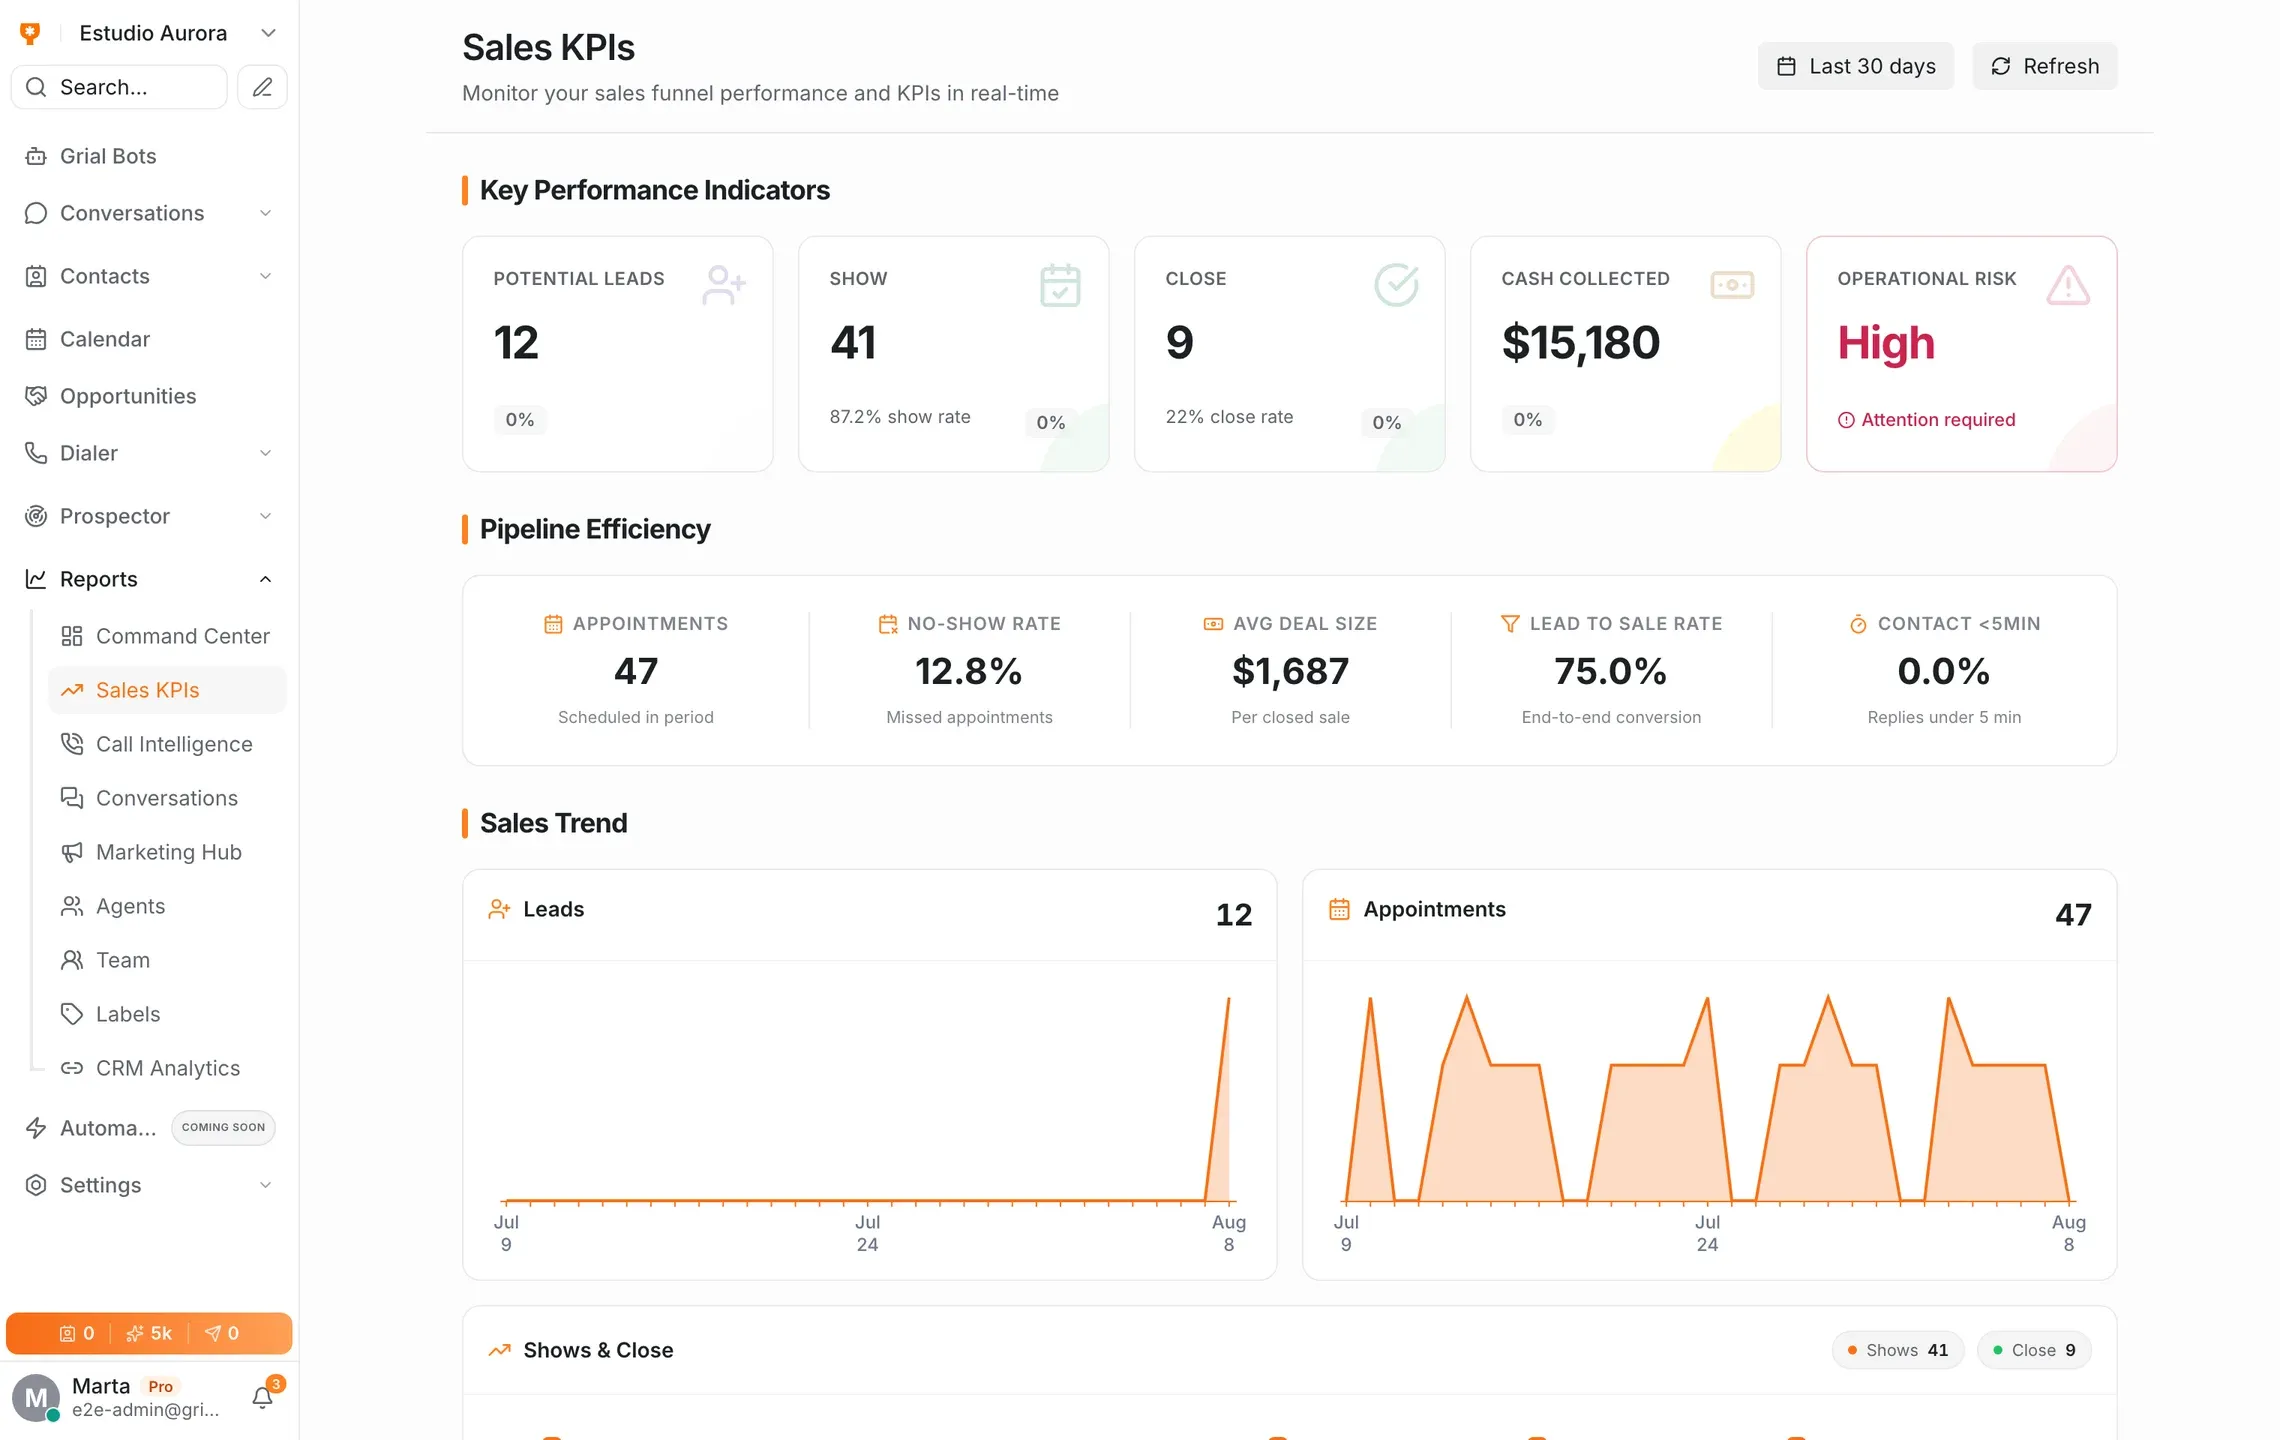
Report 7 · Sales KPIs
Where the pipeline is moving, and where it stalls
Conversion by stage and by owner, pipeline movement over the period, and a forecast for where the month is heading on the numbers you already have.
- Sales KPIs and pipeline movement for the period
- Conversion measured by stage and by owner
- Forecast for the current period
- Client and contact analytics beside the deals
The questions it answers
-
'Is this campaign working?'
Cost per lead beside what those leads actually did once they arrived.
-
'Why are we losing calls?'
Answer rate by closer and by service shows where the phone is going unanswered.
-
'Who needs support?'
Performance by owner and by closer, without anyone building a spreadsheet.
Common questions
What is Reports?
Grialink Reports brings together sales, customer service, call and marketing metrics. Review activity from your account and supported integrations, filter reporting periods and compare results. Grial Mind lets authorized team members ask for these reports in private chat.
Do I have to set up reports?
No. Every report is built from the conversations, opportunities and calls already in your account, so they fill in as your team works.
What do I need to connect?
Nothing for calls, conversations and pipeline — those are already in Grialink. CRM Analytics needs a GoHighLevel connection, and the Marketing Hub needs your Meta Ads account.
Where does the call scoring come from?
Grial Auditor produces the transcripts and scores, and Call Intelligence is where they are reported.
Which plans include it?
The smart dashboard is included on the Pro and Scale plans.
One connected platform
Connect the rest of your workflow
Connect your next conversation to the next step.
Start with a free account or request a demo. Discover how Grialink connects customer service, sales and follow-up with AI agents and tools your team can control.
No card for the Free plan · Features and usage vary by plan